How Do the 3 Financial Statements Link Together


The 3 financial statements link together through seven links, and each link moves one exact dollar amount between two statements. Net income feeds retained earnings and opens operating cash flow. Depreciation and working capital adjust it, capex, debt and equity move the rest, and ending cash returns to the balance sheet.
Key Takeaways
- Net income is the only number that lands on all three statements.
- Retained earnings equal the prior balance plus net income minus distributions.
- Depreciation lowers net income and PP&E, then returns to operating cash flow as an add-back.
- Increases in receivables and inventory use cash, while increases in payables supply cash.
- The ending cash balance from the cash flow statement is the cash line on the balance sheet.
How Do the 3 Financial Statements Link Together?
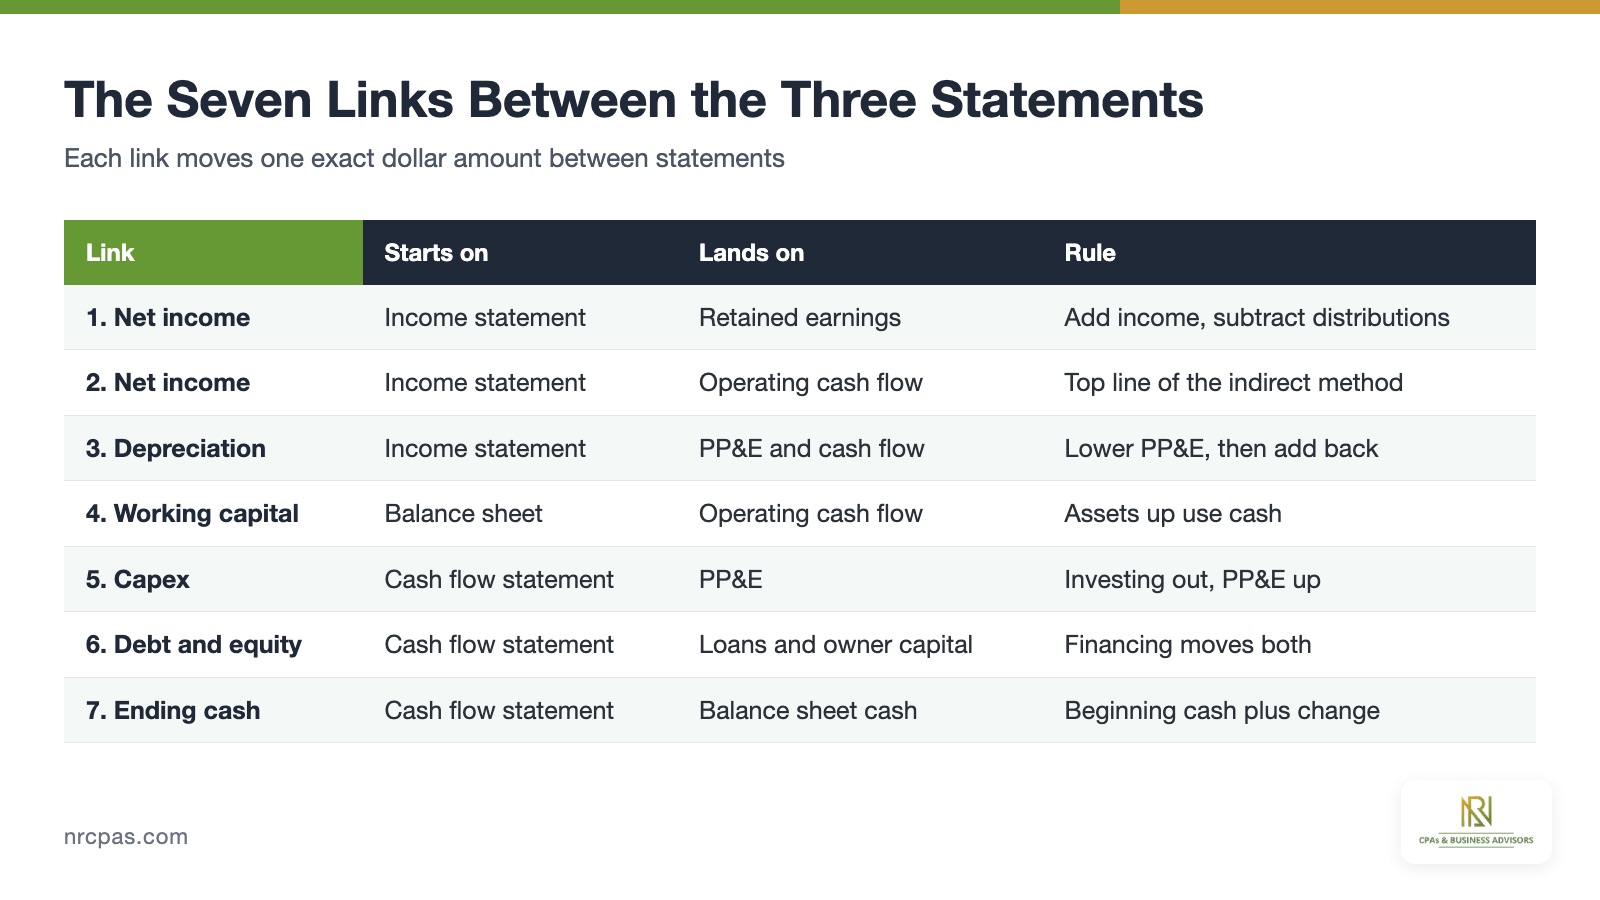
The 3 financial statements link together because each statement reuses numbers that the other two statements produce. Seven links connect the income statement, the balance sheet and the cash flow statement. The table below lists all seven in the order a preparer posts them.
| Link | Starts on | Lands on | Rule |
|---|---|---|---|
| 1. Net income to equity | Income statement | Retained earnings | Add net income, subtract distributions |
| 2. Net income to cash flow | Income statement | Top of operating cash flow | Start the indirect method here |
| 3. Depreciation | Income statement | PP&E and operating cash flow | Reduce PP&E, then add back |
| 4. Working capital | Balance sheet | Operating cash flow | Subtract asset increases, add liability increases |
| 5. Capex | Cash flow statement | PP&E | Cash out of investing, PP&E up |
| 6. Debt and equity | Cash flow statement | Loans and owner capital | Financing cash moves liabilities and equity |
| 7. Ending cash | Cash flow statement | Cash on the balance sheet | Beginning cash plus net change |
Those seven rows appear again in the graphic below, so the rest of this guide can trace each one with real numbers.
Small businesses produce these linked statements every year. According to the U.S. Small Business Administration (SBA) Office of Advocacy, the country has 36.2 million small businesses. Each one that keeps accrual books produces linked statements. Accrual accounting is the reason the links exist.
Why Are the Three Financial Statements Linked?
The three financial statements are linked because accrual accounting records revenue when earned, while cash moves on a different schedule. The cash flow statement exists to bridge that timing gap. A sale on credit raises net income today, yet the cash arrives next month.
The balance sheet holds both sides of that gap. Accounts receivable shows the sale not yet collected, and retained earnings shows the profit already earned. Professional integrated statements keep those two balances in agreement.
Regulators require all three reports together. According to the Securities and Exchange Commission (SEC), Regulation S-X calls for balance sheets from the two most recent fiscal years. Larger public companies also file three years of income statements.
The Financial Accounting Standards Board (FASB) sets the cash flow format in Accounting Standards Codification (ASC) 230. ASC 230 requires a reconciliation that starts from net income. That starting point is the first and most visible link.
How Do Net Income and Retained Earnings Connect the Statements?
Net income and retained earnings connect the income statement to the balance sheet through one roll-forward formula. Ending retained earnings equal beginning retained earnings plus net income minus distributions. The formula runs once per reporting period.
A business that starts the year with $50,000 of retained earnings, earns $48,000 and distributes $8,000 ends the year at $90,000. The $48,000 comes straight from the bottom line of the income statement. The $8,000 comes from the financing section of the cash flow statement.
Net income also opens the cash flow statement. Under the indirect method, operating cash flow starts at the same $48,000 and then adjusts for non-cash items. Net income therefore reaches two statements at once, and that is why one posting error spreads everywhere.
Tax returns mirror this link. According to the Internal Revenue Service (IRS), Form 1120-S needs a Schedule L balance sheet unless receipts and assets stay under $250,000. Owners who plan distribution timing see the retained earnings effect on that schedule.
Distributions are only one reason cash and profit differ. The larger reason is the first non-cash expense, depreciation.
How Does Depreciation Link the Three Financial Statements?
Depreciation links the three financial statements by lowering net income and PP&E, then returning to operating cash flow as an add-back. Depreciation touches every statement but never moves cash. The income statement records the expense, the balance sheet records the lower asset value, and the cash flow statement reverses the expense.
The cash left the business when the asset was bought. Depreciation only spreads that old cost across the asset's useful life. Property, plant and equipment (PP&E) is the balance sheet line that shrinks each year.
The IRS sets the schedules for tax depreciation. According to IRS Publication 946, computers are 5-year property and office furniture is 7-year property. Residential rental buildings use 27.5 years, and nonresidential buildings use 39 years.
Books and tax returns can differ here, because early tax expensing leaves a lower asset value on the return. The Section 179 expensing rules show how large that gap can be.
According to the IRS, the Section 179 limit is $2,500,000 for 2025, with a phase-out that starts at $4,000,000. For 2026, the Section 179 limit is $2,560,000, and the phase-out starts at $4,090,000. Heavy SUVs are capped at $31,300 for 2025.
The same law restored 100% bonus depreciation. According to the IRS, the One Big Beautiful Bill Act applies the 100% rate to qualifying property acquired after January 19, 2025. Owners comparing 100% bonus depreciation with Section 179 should note that both change tax depreciation, not the cash already spent.
Depreciation explains the gap between profit and cash on the asset side. The liability and receivable side produces a second gap.
How Do Changes in Working Capital Adjust Operating Cash Flow?
Changes in working capital adjust operating cash flow by converting accrual revenue and expenses into the cash actually collected and paid. An increase in an operating asset uses cash, and an increase in an operating liability supplies cash. The list below shows the four directions.
- Accounts receivable up by $6,000 reduces operating cash flow by $6,000.
- Inventory up by any amount reduces operating cash flow by that amount.
- Accounts payable up by $4,000 raises operating cash flow by $4,000.
- Accrued expenses up raise operating cash flow in the same way as payables.
A larger receivable means customers owe more, so less cash arrived than revenue suggests. A larger payable means suppliers are financing the business, so less cash left than expenses suggest.
According to FASB ASC 230, the indirect reconciliation must show changes in receivables, inventory and payables as separate items. Service firms feel this link strongly because service revenue timing often runs ahead of payment.
The effect on survival is real. According to the Bureau of Labor Statistics (BLS), 79.6% of private-sector establishments born in March 2013 were still open after 1 year. Only 50.6% were open after 5 years, and 34.7% after 10 years.
Owners who watch operating cash flow catch receivable build-ups early. Receivables and payables adjust cash from operations. Long-term purchases and borrowing adjust the other two cash flow sections.
How Do Capex, Debt and Equity Link the Balance Sheet to the Cash Flow Statement?
Capex, debt and equity link the two statements because each one changes a balance sheet line and a cash flow line equally. Capital expenditures (capex) belong in investing, while debt and equity transactions belong in financing. The three subsections below follow that split.
How Does Capex Link to PP&E?
Capex links to PP&E by raising the asset balance and creating an investing outflow in the same amount. A $25,000 equipment purchase adds $25,000 to PP&E and subtracts $25,000 from investing cash flow. The income statement shows nothing on the purchase date.
The PP&E roll-forward then finishes the job. Ending PP&E equals beginning PP&E plus capex minus depreciation. A studio that starts at $60,000, buys $25,000 and depreciates $10,000 ends at $75,000. Owners modeling financial projections build this schedule first.
How Does Debt Link to the Three Statements?
Debt links to all three statements through three different numbers. Loan principal sits on the balance sheet, interest cost sits on the income statement, and borrowing cash sits in financing. A new $15,000 loan raises the loan balance and financing cash by $15,000.
A $5,000 repayment lowers both by $5,000. The interest of $2,000 reduces net income and flows through the first link. A CFO modeling engagement usually builds a debt schedule to keep those three numbers aligned.
How Does Equity Link to Financing?
Equity links to financing through owner contributions and distributions. A $5,000 owner contribution raises owner capital and financing cash by $5,000. An $8,000 distribution lowers retained earnings and financing cash by $8,000.
Entity type decides the account names, such as members' capital for an LLC and common stock for a corporation. Every contribution and distribution still lands in financing and equity together. Those financing totals feed the last link, which is cash.
How Does the Ending Cash Balance Return to the Balance Sheet?
The ending cash balance returns to the balance sheet because the cash flow statement closes with beginning cash plus net change. The ending cash balance from the cash flow statement is the cash line on the balance sheet. Net change in cash equals operating, investing and financing cash flow added together.
The worked example below uses a fictional design studio taxed as a pass-through, so no entity income tax appears. The opening balance sheet for Year 1 holds the six amounts below, and total assets of $130,000 match liabilities plus equity.
- Cash $50,000, accounts receivable $20,000 and net PP&E $60,000.
- Accounts payable $10,000 and a bank loan of $40,000.
- Owner capital $30,000 and retained earnings $50,000.
Year 2 then produces seven events, listed in the order a bookkeeper would post them.
- Revenue of $200,000 is billed and cash operating expenses total $140,000.
- Depreciation of $10,000 and interest of $2,000 are recorded, which gives net income of $48,000.
- Accounts receivable rises by $6,000 to $26,000.
- Accounts payable rises by $4,000 to $14,000.
- The studio buys $25,000 of equipment with cash.
- The studio borrows $15,000 and repays $5,000 of the loan.
- The owner contributes $5,000 and takes $8,000 in distributions.
Each event lands on the cash flow statement exactly once, as the table below shows with the destination of every line.
| Cash flow line | Amount | Comes from | Lands on |
|---|---|---|---|
| Net income | $48,000 | Income statement | Retained earnings |
| Add back depreciation | $10,000 | Income statement | PP&E down to $75,000 |
| Increase in receivables | ($6,000) | Balance sheet | Receivables $26,000 |
| Increase in payables | $4,000 | Balance sheet | Payables $14,000 |
| Cash from operations | $56,000 | Subtotal | Net change in cash |
| Equipment purchase | ($25,000) | Capex | PP&E up |
| Loan proceeds less repayment | $10,000 | Debt | Loan $50,000 |
| Owner contribution | $5,000 | Equity | Owner capital $35,000 |
| Owner distributions | ($8,000) | Equity | Retained earnings $90,000 |
| Net change in cash | $38,000 | Sum of three sections | Cash $88,000 |
Cash from operations is $56,000, investing is negative $25,000, and financing is $7,000. Beginning cash of $50,000 plus the $38,000 net change gives an ending cash balance of $88,000.
The Year 2 balance sheet then closes with cash $88,000, receivables $26,000 and net PP&E $75,000, which total $189,000. Payables of $14,000, the loan of $50,000, owner capital of $35,000 and retained earnings of $90,000 also total $189,000. The balance sheet balances because every link was posted once.
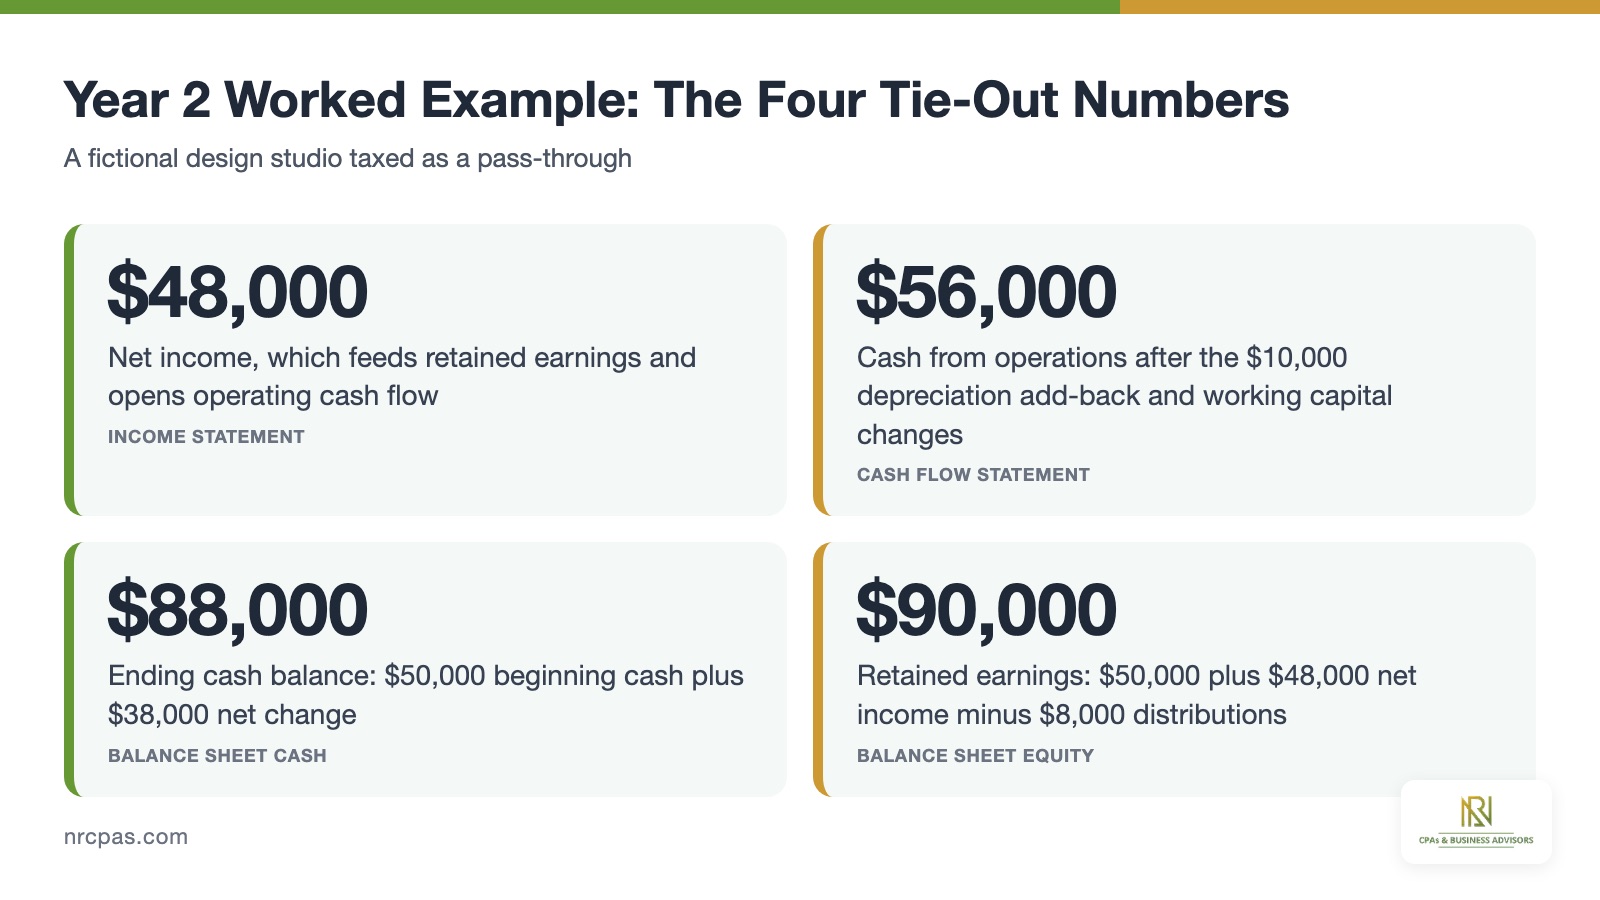
The graphic above gathers the four numbers that tie the statements together. Changing any one of them shows exactly which links move, starting with depreciation.
What Happens to All Three Statements When Depreciation Rises $10,000?
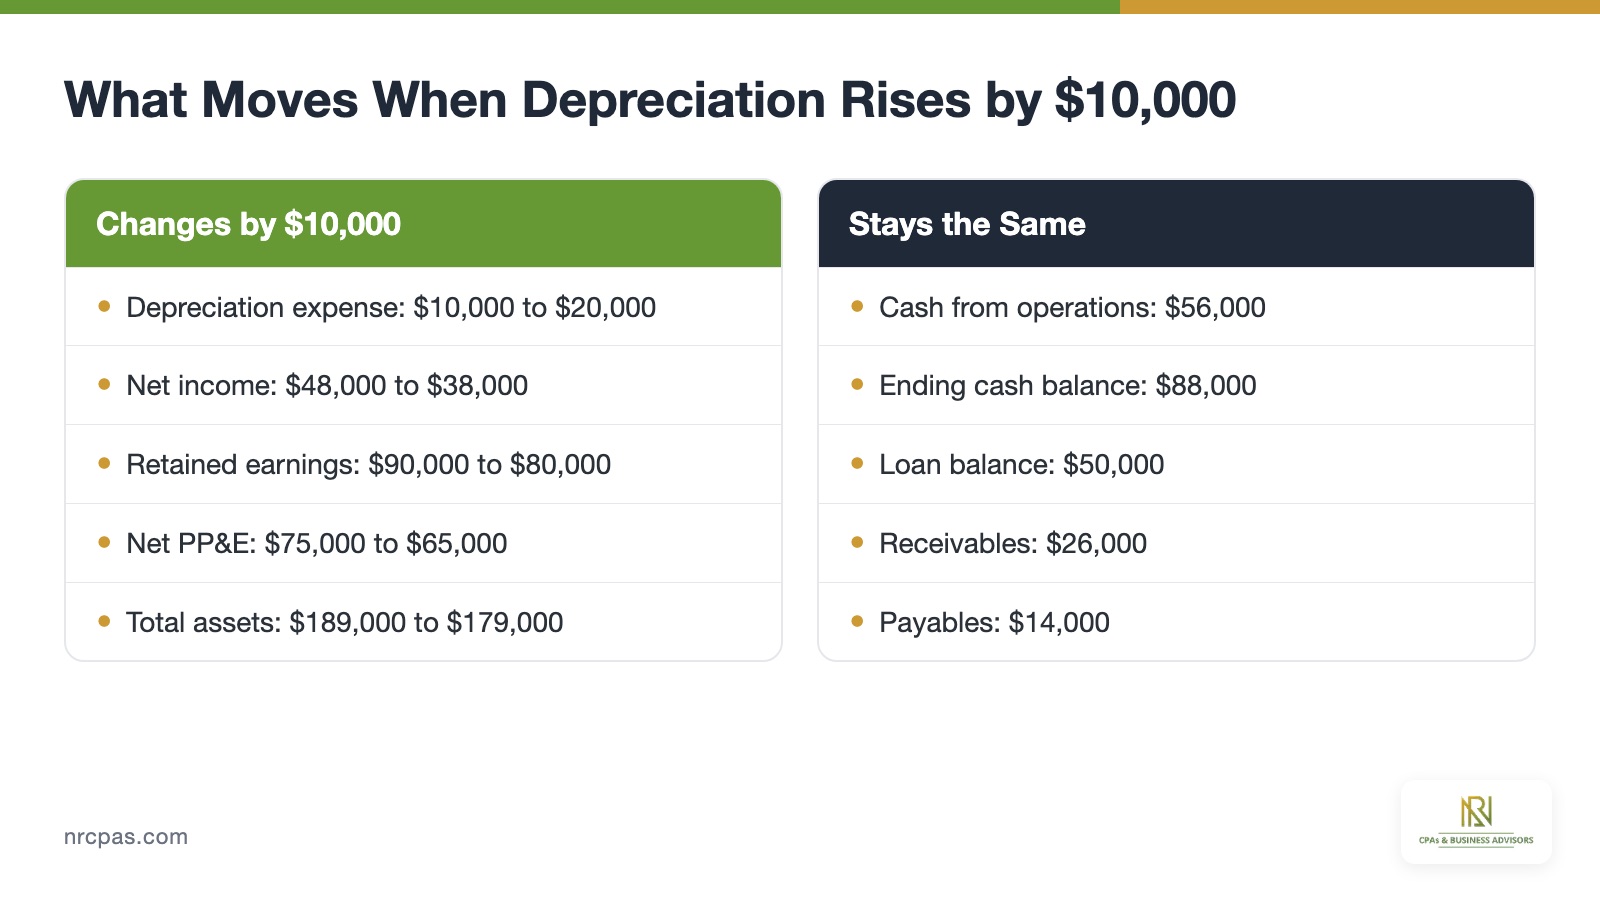
When depreciation changes by $10,000, net income, retained earnings and PP&E all fall by $10,000 while cash stays the same. A $10,000 rise in depreciation lowers total assets by $10,000 and leaves ending cash at $88,000. The table below compares the base case with the higher-depreciation case.
| Line | Base case | Depreciation $20,000 | Change |
|---|---|---|---|
| Depreciation expense | $10,000 | $20,000 | +$10,000 |
| Net income | $48,000 | $38,000 | -$10,000 |
| Retained earnings | $90,000 | $80,000 | -$10,000 |
| Net PP&E | $75,000 | $65,000 | -$10,000 |
| Cash from operations | $56,000 | $56,000 | $0 |
| Ending cash balance | $88,000 | $88,000 | $0 |
| Total assets | $189,000 | $179,000 | -$10,000 |
Operating cash flow stays at $56,000 because net income falls to $38,000 while the add-back rises to $20,000. The two moves cancel. Both sides of the balance sheet drop by $10,000, so assets of $179,000 still equal liabilities plus equity.
Taxes add one more effect outside the pass-through case. According to the IRS, the corporate income tax rate is 21%, so a taxed corporation saves $2,100 on a $10,000 expense. That saving raises cash, while the depreciation itself does not.
What Else Should Owners Know About Linked Financial Statements?
Linked financial statements raise a few more practical questions about interviews, models, balance checks and errors. The sections below answer each one briefly.
How Are Financial Statements Interconnected in a Small Business?
Financial statements are interconnected in a small business through the same seven links, posted from one general ledger. The bookkeeper records a transaction once, and the software places it on the right statements. Owners who learn the links can spot a wrong balance within minutes.
A Florida owner is in a large group. According to the SBA Office of Advocacy, Florida has 3.49 million small businesses, behind only California and Texas.
How Do the 3 Financial Statements Link Together in an Interview?
State how the three financial statements are linked in an interview with a short chain of net income, adjustments and cash. Net income flows to retained earnings and to the top of operating cash flow. Depreciation is added back, capex and financing change PP&E and debt, and ending cash returns to the balance sheet.
What Is a 3 Statement Financial Model?
A 3 statement financial model is a forecast that links the income statement, balance sheet and cash flow statement through formulas. The model repeats the seven links for each future period. A business advisors team often builds the first version from three years of history.
How Are the P&L and Balance Sheet Linked?
The P&L and balance sheet are linked through retained earnings, PP&E, receivables, payables and debt. Net income closes into retained earnings each period. Depreciation reduces PP&E, and interest relates to the loan balance.
What Is the Golden Rule of the Balance Sheet?
The golden rule of the balance sheet is that assets equal liabilities plus equity at all times. A balance sheet that does not balance means a link was posted on one side only. Finding the difference usually points to a missing add-back, a sign error or an unrecorded cash item.
Which Mistakes Break the Links Between the Statements?
Four mistakes break the links most often, and the list below names each one.
- Forgetting to add depreciation back on the cash flow statement.
- Reversing the sign on an increase in receivables.
- Recording equipment as an expense instead of capex.
- Posting a distribution to expenses instead of retained earnings.
Each mistake leaves the balance sheet out of balance by a round amount. Fixing the first one restores the add-back, and the check returns to zero.
How Long Should the Supporting Records Be Kept?
Supporting records should be kept for at least 3 years from the filing date, according to the IRS. The IRS extends that period to 6 years when unreported income exceeds 25% of the gross income shown. Bank statements, loan agreements and asset invoices all support the links.
Founders face this early. Early-stage founders who document loans and equity from day one avoid rebuilding the ledger at the first audit.
Who Can Build and Check Linked Statements?
A CPA can build and check linked statements by tying every link to the ledger each month. We prepare income statements, balance sheets and cash flow statements that reconcile to each other, led by founder Nischay Rawal, CPA, EA. Reach the office at (305) 872-3096.
Business owners who want linked statements built correctly can work with the NR CPAs preparers and their team.
The question "how do the 3 financial statements link together" has one answer in dollars: seven links and $88,000 of ending cash. Owners with similar questions can request three-statement packages that show those links in their own numbers.